gfmslope-lhms.app
For GFM inspectors and the asset owner's inspection staff.
- Inventory, routine and detailed inspections, and risk assessment
- Photos, sketches, and GPS points in one form
- Drafts saved on the device and sent when the signal returns

LHMS
Landslide Hazard & Monitoring System
LHMS is a WebGIS-based system for monitoring, assessing, and managing slope risk in one place. Toll-road operators use it to map hundreds of slopes, prioritise inspections, and follow up on findings. It is built and operated by the GFM team.
Forms and assessments follow the Indonesian Ministry of Public Works guideline (Kepmen PUPR 175/KPTS/2023) and the Hong Kong GEO Geoguides.
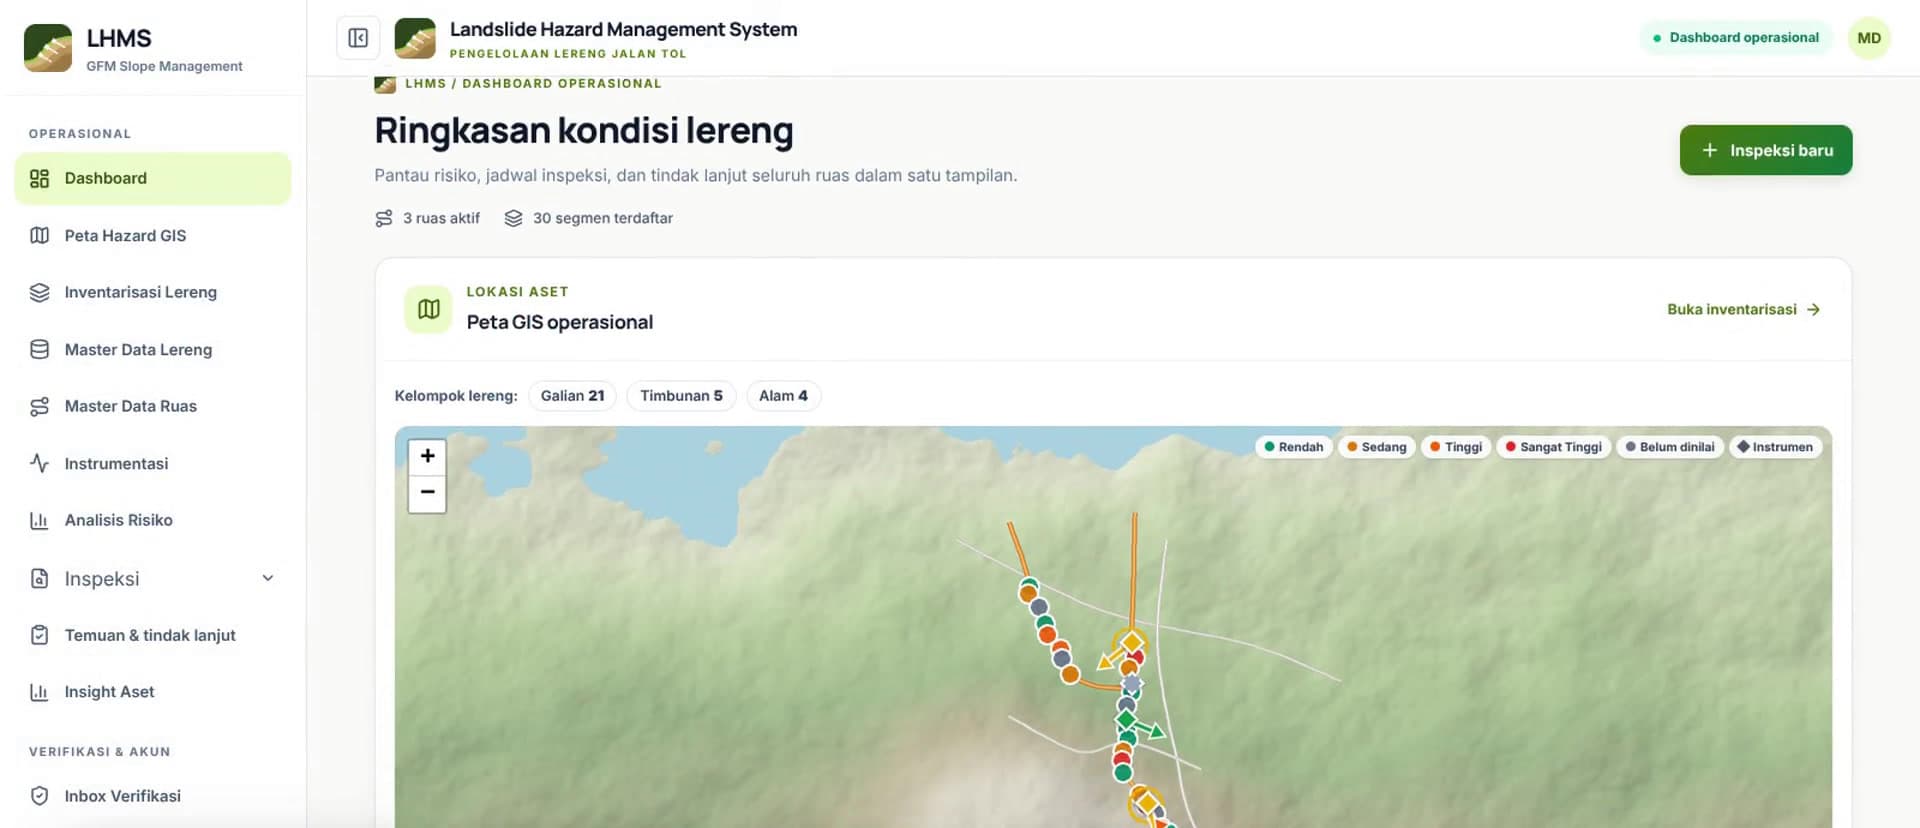
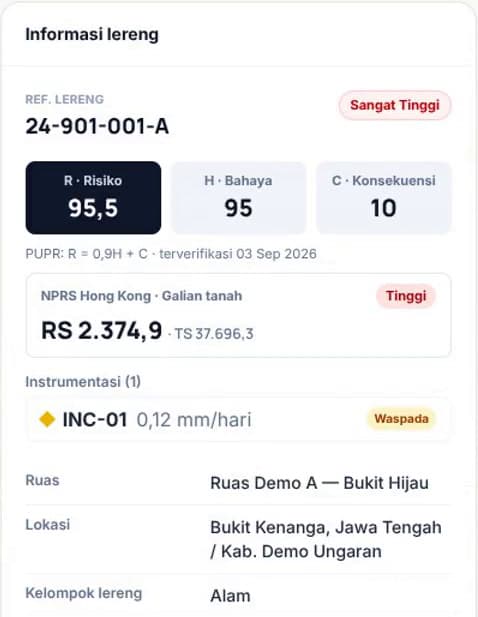
Screens from lereng.gfm-consult.com with sample data.
Quick tour
Nine core features, from the dashboard and hazard map to reporting. Screens show sample data, not client asset data.
How LHMS is used
Field inspection, then every asset enters the GIS database.
Hazard and consequence scores produce a priority list.
Routine and engineering inspections are scheduled from the ranking.
Protective works are designed in order of priority.
Maintenance, inspection, and strengthening costs are estimated per asset.
Two apps, one account
The same account works on both addresses. You sign in separately on each, and access still follows each user's role.
For GFM inspectors and the asset owner's inspection staff.
For verifiers, managers, and asset owners.
Everything asset-owner teams and field inspectors use today, from inventory to reporting.
In use
One database for every slope on every section.
Inspectors fill in the official forms directly on a tablet.
Field paperwork is filled in once per activity.
Field data becomes an order of treatment.
Every finding has an owner and a deadline.
From hundreds of forms to a portfolio view.
LHMS roadmap
LHMS grows from the needs of users in the field. Features in trials or planned are not yet part of the standard service; we share release dates directly with users.
In use
Used by clients today
6modules
Slope inventory & map
One database for every slope on every section.
Field inspection
Inspectors fill in the official forms directly on a tablet.
Preparation & safety
Field paperwork is filled in once per activity.
Risk assessment & priorities
Field data becomes an order of treatment.
Findings & verification
Every finding has an owner and a deadline.
Reports & insight
From hundreds of forms to a portfolio view.
In field trials
Built, being tested in the field
3features
Instrument monitoring
Inclinometers, piezometers, crack meters, survey pegs, and settlement plates per slope. Reading reports in PDF are parsed into charts, with Alert, Alarm, Action thresholds and movement direction on the map.
Special inspections
Triggered by high risk, extreme rainfall, emergencies, or instrument thresholds being exceeded.
Full offline field mode
Forms opened and filled with no signal at all, then synchronised in the background.
Planned
In the development queue
5features
Notifications
Email and push alerts for due inspections, new findings, and instrument thresholds.
Scheduled reports
Periodic summaries sent automatically to the asset owner.
Mitigation budget estimates
Maintenance, inspection, and strengthening costs per slope from the priority list.
Advanced spatial analysis
Spatial database (PostGIS) for analysis across map layers.
Priority & drainage summaries
Official P1/P2/P3 slope counts and lengths of good/damaged drainage per section on the insight page.
We will prepare a demonstration with sample data for the type of assets you manage.
Or write directly to contact@gfm-consult.com